How to use data to strengthen your NPO 2028–33 application
The strongest National Portfolio 2028–33 applications won't be the ones with the most data. They'll be the ones that use the right figure to prove each point the form asks for. Applications open on 20 October 2026 and close at 12:00 midday on 15 December 2026. That leaves about eight weeks to turn the numbers you already hold into evidence an assessor can trust.
The form gives you typed answers and strict character limits, from 500 to 5,000 characters. There's no space for charts, appendices or annual reports. Every figure has to earn its place inside a sentence.
Most arts organisations aren't short of data. You have ticketing reports, survey results, finance records, monitoring returns and partner feedback. The gap is between having that data and using it: knowing which number answers which part of which question, and writing it so it lands. This guide covers how to close that gap.
1. Answer the question that's asked, point by point
Each question in the form comes with a short list of things Arts Council England wants you to tell them. Treat that list as your structure. Assessors read against it, and an answer that skips a point is weaker however good the rest is.
Take the question about the work that best shows your excellence. It asks you to cover four things:
The work or activity that best demonstrates your excellence
What you set out to achieve, and what you achieved
Who benefited, and how
The evidence of excellence, and the outcomes or benefits it achieved
Before you write a word, put one or two figures against each point. If a point has no figure, that's your first gap to fill, not something to paper over with adjectives. You don't need data for every sentence. You need it for every claim.
2. Never give a number on its own
A figure on its own tells the assessor very little. Is 6,200 people a lot? It depends on your size, your venue and your starting point. Give every figure a comparison so the reader can judge it in one go. There are three kinds that work:
| Comparison | What it shows | Example |
|---|---|---|
| Over time | Growth, or that you held steady through a hard period | Attendances rose from 41,200 in 2023/24 to 48,300 in 2025/26 |
| Against a target | That you plan well and deliver what you promise | We aimed for 45,000 visits and achieved 48,300 |
| As a share of the whole | Who you reach, compared with everyone you reach | 34% of bookers were first-time attenders |
Missing a target isn't fatal. An honest figure with an explanation of what you learned is often more convincing than an unbroken run of successes. It shows the kind of self-awareness assessors look for in an organisation they'll fund for years.
3. Write the data as sentences, not tables
Without charts, your data has to read well as prose. A good evidence sentence has three parts: the claim, the figure with its comparison, and what it means. Compare these:
Weak: “Our audiences have grown significantly and we are reaching lots of new people.”
Better: “Audiences grew by 17%, from 41,200 to 48,300.”
Strongest: “We set out to bring people who had never been to the theatre into our building. Audiences grew by 17%, from 41,200 in 2023/24 to 48,300 in 2025/26, and first-time attenders rose from 28% to 34% of all bookers.”
The strongest version links the figure to an aim, gives two comparisons, and uses specific years. It's still only around 250 characters.
A few habits make figures easier to read:
Round sensibly. 48,300 is easier to take in than 48,297, and nobody will doubt you.
Use the same years and definitions throughout. If “audiences” means paid attendances in one answer, it shouldn't include workshop participants in another.
Keep percentages and percentage points apart. A rise from 28% to 34% is 6 percentage points, not 6%.
Put no more than two or three figures in a sentence. Spread them across the answer rather than front-loading them.
4. Which data proves what
Different questions need different evidence. Looking back (Previous Work and Development) calls for results. Looking forward (Proposed Activity) calls for targets and the evidence of need behind them. Governance, leadership and finance call for the facts and ratios that show you're well run.
| Question | What it needs to prove | Data points that make the case |
|---|---|---|
| PW1 Your best work (5,000) | Your strongest work was excellent and benefited people | Targets against results; attendances and participants; first-time attenders; reach in Culture Priority Places; audience ratings; reviews, awards and touring invitations |
| PW2 How you've developed (3,000) | You've improved quality, inclusion and resilience | Trends in audience ratings; diverse and disabled audiences; concession tickets; partnerships lasting three years or more; earned income share; free reserves |
| PR1 Your plans (5,000) | Your plans are ambitious, realistic and needed | Activity and reach targets for 2028–33 against today; local arts engagement and deprivation figures; sold-out performances; partner commitments |
| PR2 Who it's for (3,000) | You'll reach people with limited access to culture | People reached in Culture Priority Places; disabled and lower-income audiences; children and young people; jobs, training and volunteering created |
| PR3 Your development (3,000) | Investment will make you stronger | Workforce and board representation; access standards; earned income share; months of free reserves |
| GOV1 Governance (3,000) | You're well governed | Board size and independence; meetings and attendance; KPIs reported to the board; risk register reviews |
| GOV2 Risks (3,000) | You understand your real risks | Largest funder as a share of income; months of free reserves; trends in earned income and repeat bookers; staff turnover; energy costs |
| DEM Leadership data (tables) | Who leads your organisation | Board and senior team by characteristic, as the form's tables ask |
| ADD Extra investment (3,000) | Extra money buys clear, costed results | What each area would deliver; extra people reached; cost per person; how the costs add up to the request |
| FIN Finances (tables and 2,000 / 2,000 / 500) | Your forecasts are sound | Income and spending, actual against expected; confirmed income; inflation assumption; a stress test; net current assets; reserves against your policy |
You don't need everything in the right-hand column. One or two strong figures for each point the question lists will beat ten weak ones.
5. Where to find it
Most of what you need is already in your systems. It just hasn't been pulled together.
Ticketing and booking systems: attendances by year, new against returning bookers, sold-out performances, concession tickets, and bookers' postcodes.
Finance records: income by source, artist and freelancer fees, spending on the programme, reserves, and the figures in your accounts.
Audience and participant surveys: quality ratings, Net Promoter Score, demographics, and the outcomes people report, such as new skills or confidence.
Learning and participation records: registers, sessions delivered, schools worked with, and pre- and post-session evaluation.
Your returns to Arts Council England: if you're a current NPO, the data you've already submitted is a consistent record over several years. Use it so your figures match what the Arts Council already holds.
Free public data: census and local population figures, deprivation rankings, and local arts engagement rates help show need in your area.
Postcode analysis: matching your bookers' postcodes to local authorities shows how many people you reach in Culture Priority Places, the 81 areas the Arts Council is prioritising.
If something isn't recorded at all, say so honestly and explain how you'll measure it from 2028. A credible plan to collect data is better than a guess.
6. Six mistakes that weaken good evidence
Relying on charts and formatting. Bullets, bold text and tables may be lost when you paste into the Arts Council's online system. Write in plain paragraphs and let the sentences carry the data.
Figures with no comparison. “We reached 6,200 people” invites the question “is that good?” Add a trend, a target or a share.
Numbers that don't add up across answers. Assessors read the whole application. If attendances are 48,300 in one answer and 52,000 in another, they'll notice. Keep one master set of figures and use it everywhere.
Too many numbers in one place. A paragraph of statistics is hard to take in. Choose the figures that prove the point and leave the rest out.
Writing to the limit, then cutting at the last minute. Anything over the character limit is deleted. Draft to about 95% of the limit, so small differences in how characters are counted don't cost you your last sentence.
Plans with no baseline. A target only means something next to where you are now. “Grow from 1,800 to 3,000 young people a year by 2032/33” is a plan. “Reach more young people” is a hope.
7. A plan from now to the deadline
Start gathering your data now, before the portal opens, and aim to submit by 8 December. A week's buffer means a late figure or a technical problem won't put your application at risk.
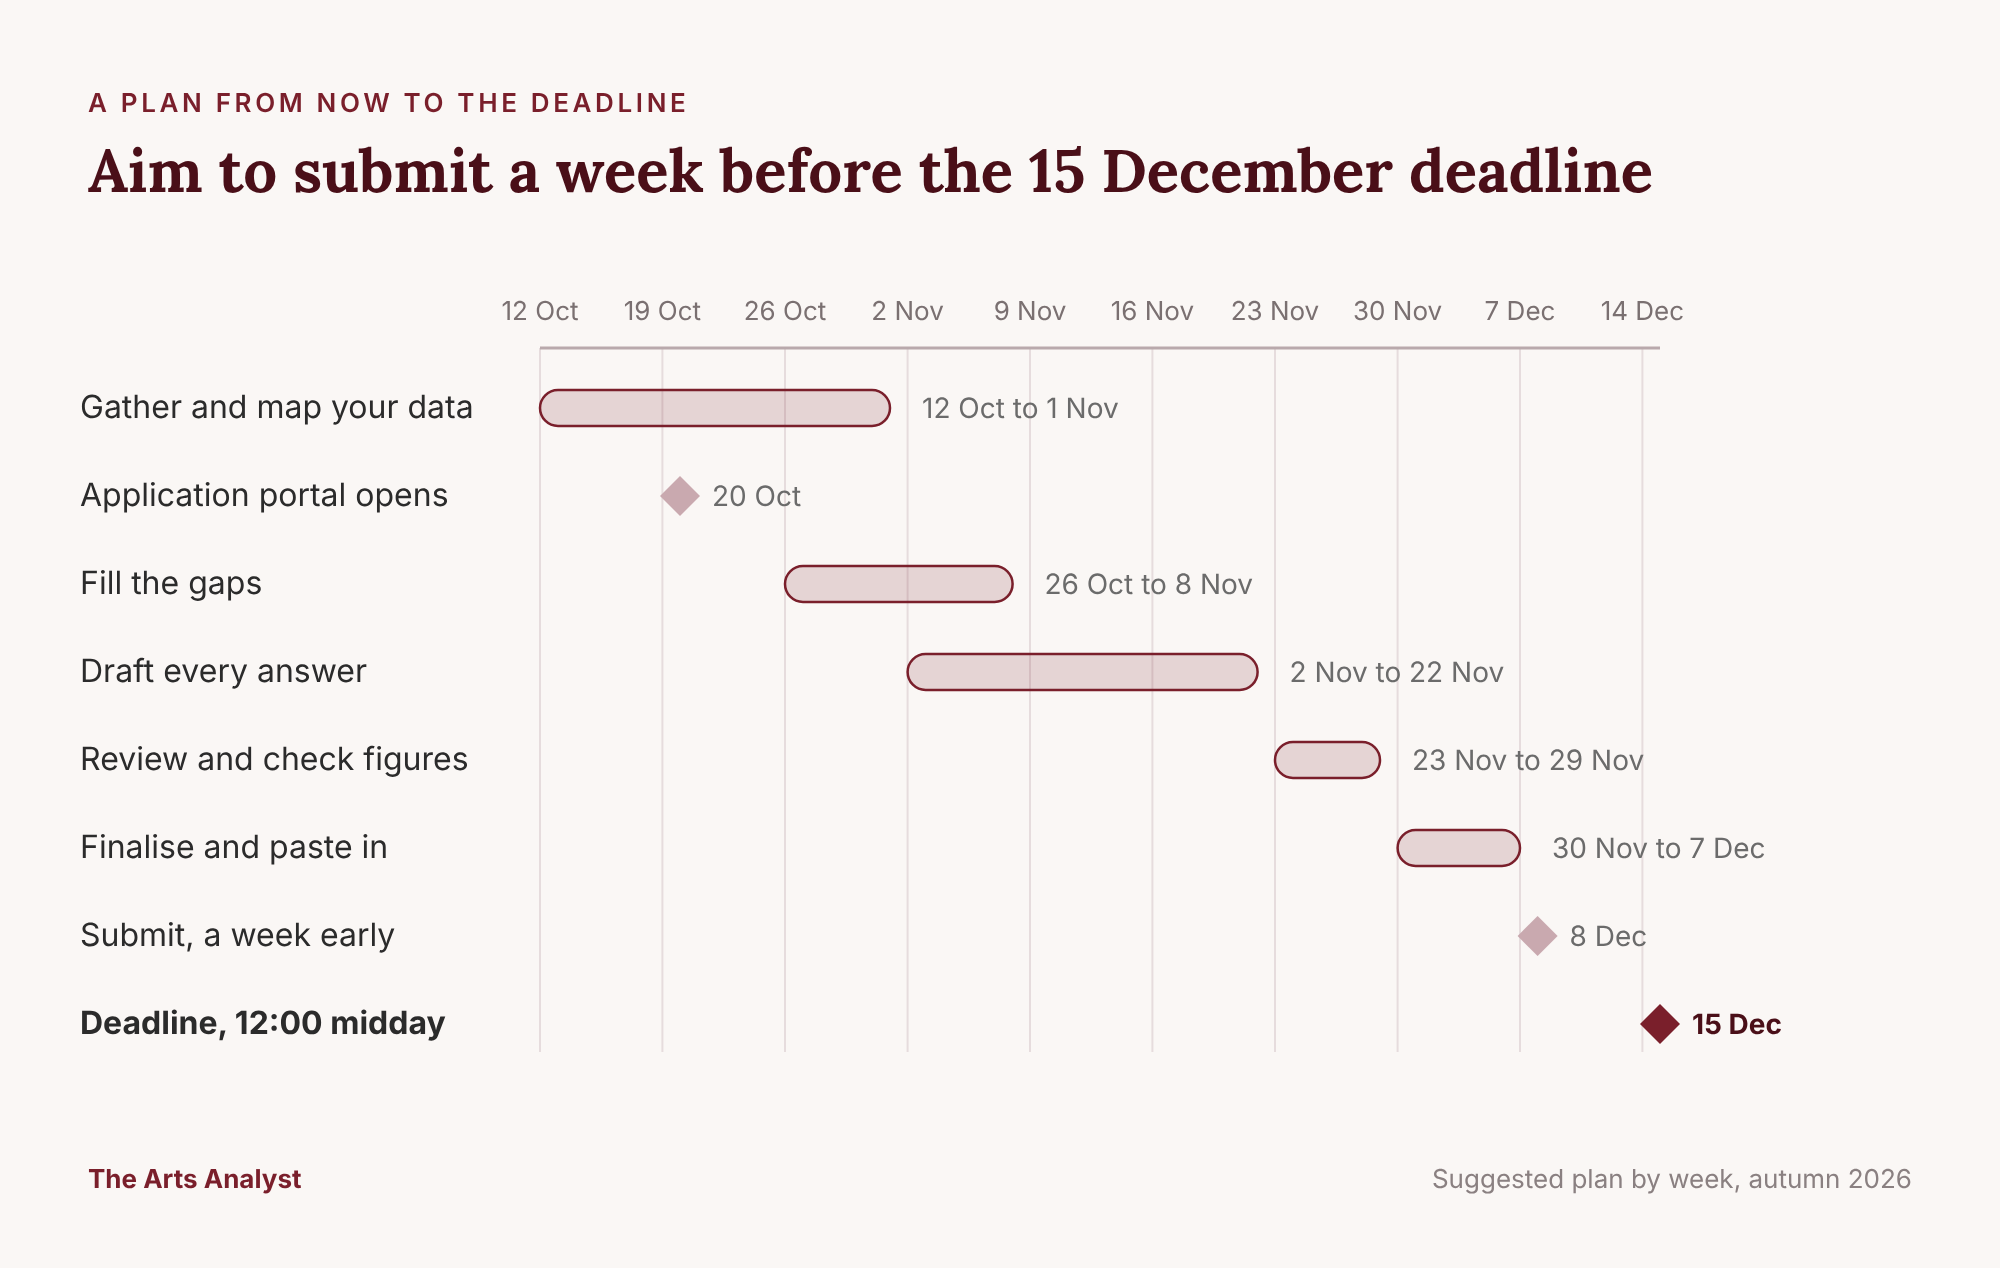
Gathering, filling gaps and drafting overlap on purpose: writing your first draft is the quickest way to find the figures you're still missing. Leave the final review to someone who hasn't seen the drafts, and ask them to check every figure matches across answers.
Do it faster with the NPO Evidence Workbook
We built the NPO Evidence Workbook to do all of the above in one place. It's an Excel workbook with a page for each question in the 2028–33 application.
Each page starts with what the form asks, split into the numbered points assessors read against.
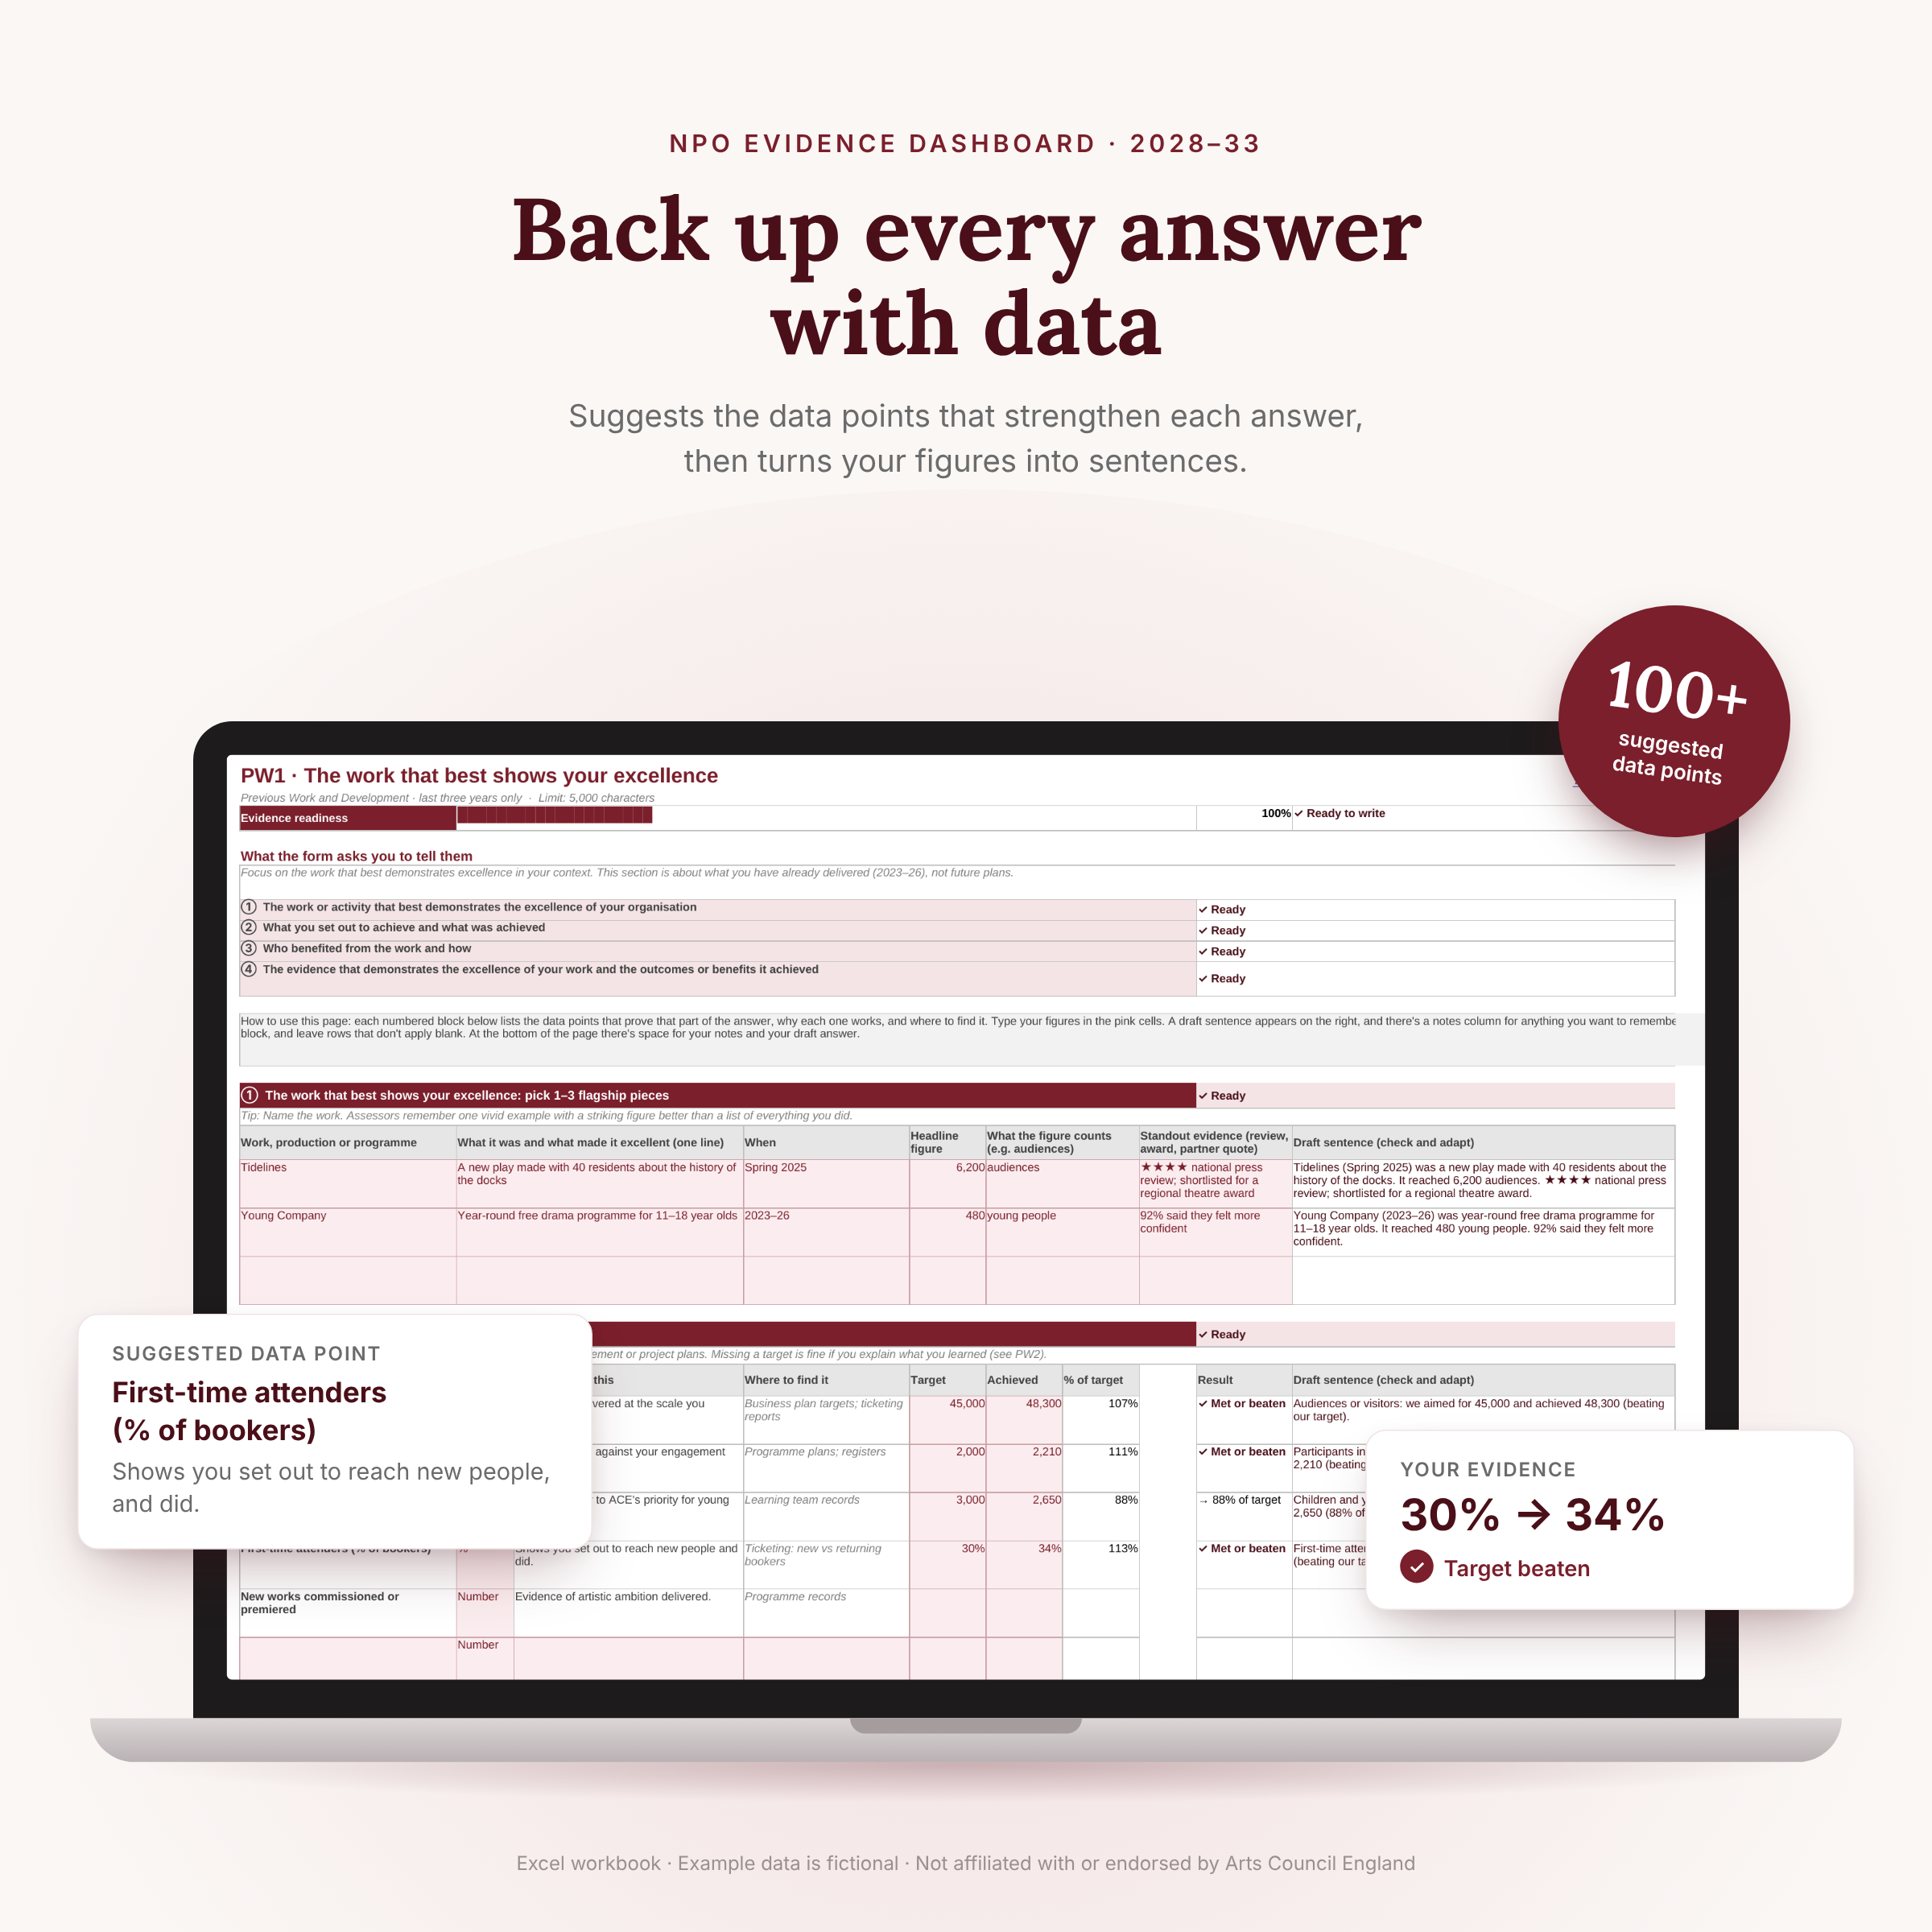
Over 100 suggested data points, matched to each point, with why each one strengthens your answer and where to find it.
Sentences written from your figures. Type in your numbers and the comparisons appear as sentences you can adapt, such as “Total attendances rose by 17%, from 41,200 to 48,300 between 2023/24 and 2025/26.”
A draft box for every written answer, with a live character count, a 95% safe target and a checklist of every point the question asks you to cover.
A readiness dashboard showing which answers have their evidence and which still have gaps, with a shared to-do list so the whole team can help.
Finance checks that flag changes over 20% to explain, work out your key ratios and stress-test your income.
Built-in error checks that catch a “TBC” in a figure cell, a percentage typed as 34 instead of 34%, or a negative count, before it reaches your application.
It works for current NPOs and first-time applicants, in Microsoft Excel on Windows or Mac.
Back up every answer in your National Portfolio application with data.
The Arts Council England National Portfolio 2028–33 application asks you to prove your case in writing. You can't add charts, and every answer has a strict character limit. Most organisations already have the evidence. The hard part is knowing which figures prove which point, and getting them into a strong answer before the deadline.
This Excel workbook goes through the application one question at a time. It suggests the data points that strengthen each answer, explains why each one works and where to find it, then turns your figures into sentences you can use.
How it works
Pick a question. Each page starts with exactly what the form asks, split into numbered points.
Add your figures. Under each point you'll find the data that makes the strongest case, why it works, and where to find it: ticketing, finance, surveys or free public data.
Write and check. Sentences built from your figures appear as you type. Draft your full answer in the workbook, check it against the character limit, and tick off every point the question asks you to cover.
What's inside
10 question pages:
PW1 Your best work
PW2 How you've developed
PR1 Your plans
PR2 Who it's for
PR3 Your development
GOV1 Governance
GOV2 Risks
DEM Leadership data
ADD Extra investment
FIN Finances
Over 100 suggested data points, each with why it strengthens your answer and where to find it
Sentences written from your numbers, such as "Total attendances rose by 17%, from 41,200 to 48,300 between 2023/24 and 2025/26"
A draft box for every written answer, with a live character count and a safe target set at 95% of the limit
"Every point covered?" checklists, so no part of a question is missed
An evidence readiness dashboard showing where your evidence is strong and where it's thin
Finance checks:
flags any income or spending change over 20% that you'll need to explain
works out your key ratios
stress-tests your income
Built-in error checks that warn you about typos such as "TBC" in a figure cell, a percentage typed as 34 instead of 34%, or a negative count
Notes on every table and page, plus a team to-do list for sharing out the evidence-gathering
Who it's for
Arts and cultural organisations applying to the 2028–33 round, whether you're already funded or applying for the first time
Directors, fundraisers, bid writers and the consultants who support them
Format
Microsoft Excel workbook (.xlsx) for Windows or Mac; also opens in Google Sheets
Instant download, no macros
Key dates: applications open on 20 October 2026 and close at 12:00 midday on 15 December 2026.
This is an independent resource. It is not affiliated with or endorsed by Arts Council England. It helps you organise and present your evidence. It does not write your application or guarantee funding. Always check Arts Council England's current guidance.
Questions? Email info@theartsanalyst.com
FAQ
What data should I include in my NPO 2028–33 application?
Choose figures that prove each point the question asks for. Good examples are audience and participant numbers over time, first-time attenders, reach in Culture Priority Places, quality ratings, and artists and freelancers paid. Comparisons over time, against a target or as a share of the whole make the strongest evidence. The workbook suggests over 100 data points, matched to each question.
Can I use charts or tables in my NPO application?
No. The written answers are typed text with character limits, and formatting such as bullets, bold and tables may be lost when you paste into Arts Council England's system. That's why this workbook turns your data into written sentences you can paste straight in.
How do I evidence excellence for Arts Council England?
Name one or two flagship pieces of work. Then back them up with specific figures: what you set out to achieve against what you achieved, who benefited, and independent evidence such as audience ratings, reviews or awards. The PW1 page takes you through this step by step.
I'm applying for the first time. Is this for me?
Yes. It works for current National Portfolio Organisations and first-time applicants alike. Leave blank any rows that don't apply. You only need one or two strong data points for each part of a question.
What if I don't have all the data?
Each data point comes with suggestions of where to find it, including free public data. The readiness dashboard shows which questions still need evidence, so you can prioritise before the deadline.
Does it work in Google Sheets?
It's designed for Microsoft Excel on Windows or Mac and also opens in Google Sheets.
Is this an official Arts Council England resource?
No. It's an independent resource created by The Arts Analyst, a data analysis consultancy for arts and culture organisations. Always check Arts Council England's current guidance and application form.
Want a second pair of eyes on your evidence? Email info@theartsanalyst.com.
Frequently asked questions
What data should I include in my NPO 2028–33 application? Include the figures that prove each point the question asks for, each with a comparison: over time, against a target or as a share of the whole. Audience and participant numbers, first-time attenders, reach in Culture Priority Places, quality ratings and artists paid are strong starting points.
Can I use charts or tables in my NPO application? No. The written answers are typed text with character limits, and formatting may be lost when you paste it in. Turn your data into clear sentences instead.
How many figures should I use in each answer? One or two strong figures for each point the question lists is usually enough. More numbers don't make an answer stronger if they don't prove the point.
What if I don't have the data? Use what you have, say honestly what you don't record, and explain how you'll measure it from 2028. A credible plan to collect data is better than an estimate presented as fact.
I'm applying for the first time. Does this apply to me? Yes. First-time applicants need to evidence their track record just as much as current NPOs. Your figures may cover fewer years, so lean on targets met and the outcomes for the people you work with.
The Arts Analyst is an independent data consultancy for arts and culture organisations. This guide is not affiliated with or endorsed by Arts Council England. Always check the Arts Council's current guidance and application form.